Summary View Overview
Summary View displays an object’s data in an outline form based on a summary view layout file. A summary view usually arranges an object’s data in multiple panes: one pane for the object’s own data and several carefully structured panes for connected objects. For example, a company summary view may look as follows:

Figure 1. Example of summary view showing company data
A properly structured summary view should help you to:
Focus on the key information. The view above is configured to display the key data about the company and all objects connected to it.
Pay attention to the current data. For example, the “Events” pane lists only a few most recent past events, as well as the nearest future ones, connected to the main company:

Figure 2. Only events relevant right now are shown
Analyze business facts. Panes may be designed which not only filter through database objects but, in addition, automatically calculate and publish total values of an object field:

Figure 3. Company sales cases can be summed up and grouped by status
Pick relevant data from huge archives. A pane usually filters through the connected objects and shows only those which match some condition:
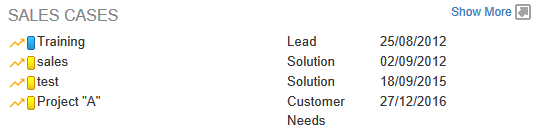
Figure 4. Only active sales cases are listed from all connected ones
A click on the Show More icon or link will open all sales cases in a table:

Figure 5 Full contents of an expanded pane can be displayed as a table
Comments
0 comments
Please sign in to leave a comment.